Monday, May 19, 2014

Some Alternate Views

Greetings from Memphis in May BBQ Fest!  As we try to cut through the pork-induced food fog, we figured it might be interesting to check in on a few charts showing some trends that might provide some different perspective on recent and future market moves.

First, we want to take a quick look below at the historical S&P 500 price relative to spot Gold.  We see this chart from time to time among various pundits and analysts.  The interesting aspect of this chart over the past year or so is the significant trend change that has taken place.  When the ratio moves higher, S&P 500 prices are outpacing Gold, and vice versa.  We have the ratio’s 200-week moving average represented on the chart.  As you can see, going back to the late 1970’s, major movements through the 200-week moving average have coincided with major, long-term turns in the secular bull/bear equity market trend.  For instance, the ratio moved solidly through the moving average in 1982/1983 just as the market began a nearly 20 year run towards highs in 2000.  Conversely, this ratio broke down through the 200-week in early 2001 just as the decade long secular bear in equities was beginning to take hold (with Gold moving in the opposite direction, ever upward).

Lo and behold, the ratio made a decisive break higher through the 200-week at the beginning of 2013.   The 200-week moving average is moving higher for the first time since the last bull run.  We don’t want to make a decisive call that a 15 to 20 year secular bull is on the way, but it does show us that market dynamics and attitudes have changed in an eye-opening way.  Though sentiment surveys still show healthy skepticism towards equities, in practice markets have become much more comfortable with risk and more skeptical of safety trades.
Next, we’ll keep Gold prices in the equation by showing Gold price relative to the trade-weighted dollar index.  Once again, we see another significant shift through the 200- week moving average after a massive move higher over the past decade.  Like the ratio above with the S&P 500, this ratio burst out to the upside in the early 2000s, but has tumbled downward over the past year and a half as gold tumbled and the trade-weighted dollar showed strength, confounding many prognosticators.  Perhaps this trend shift after such a long run higher means that, intermediate-term, calls for the death of a dollar-based global financial system are premature?  
Moving back to equities, another interesting perspective below is the so-called Fed Model.  This model shows the relationship between earnings yield (the inverse of P/E: the lower the P/E ratio, the higher the earnings yield) and long-term Treasury yields.  Theoretically, higher levels in the ratio indicate an undervalued equity market and vice versa.  We’re very aware that the traditional Fed model has performed very poorly from a predictive market-timing standpoint.  Most Fed Model representations use trailing 12-month P/E, which can be quite volatile, especially during major shifts in the earnings cycle.  We’ve substituted the Shiller 10-year CAPE P/E in place of trailing 12-month to provide more stability to the indicator.  

As you can see, extreme movements above or below the +1/-1 standard deviation band have been associated with market lows and highs since the early 1960s.  For instance, the move above the 1 standard deviation band in mid-1962 marked the beginning of a equity market run into the late 1960s during which the S&P 500 doubled in price.  A similar spike in 1974 marked the bottom (though not the absolute end) of the 70s secular bear market.  Markets moved meaningfully higher off those ’74 lows.  Fast-forward and the move below the bottom of the band in the late 1990s coincided with the end of the massive 80s/90s bull run.  Look at the amazing moves above the band in financial crisis and post-crisis months and years.  Combine a devastating equity market selloff and P/E compression cycle with super-low Treasury yields, and you get moves several standard deviations above the norm. Even with the substantial equity market move higher since 2009, the ratio is just now approaching the top portion of the standard deviation band.

Of course this situation could play out several different ways if we assume that the ratio will eventually work its way back into more normal territory.  For instance, Treasury yields could spike higher while equities remained neutral.  Equity markets could continue to move higher while Treasury yields did the same.  Or, equities could continue to move ever higher (P/E expansion) while Treasuries continue to meander around current levels.  Whatever happens, the chart tells us a few things.  First, we get a great visual representation of the strange market distortions that played out during and after the financial crisis.  Second, looking at the various scenarios, it’s not a major stretch to argue that equity prices could continue to defy the skeptics and move higher via multiple expansion channels.
We’ve also produced an alternate take to this model using corporate investment grade yields instead of Treasuries.  Just like the more traditional Fed Model above, we get a similar picture.  Equities seem to be in a favorable position relative to investment grade debt.  
Is there a thread or theme unfolding through these alternate-view charts?  If anything, we just might be able to draw the conclusion that equity markets could continue to defy the widely held view that the upward trend is significantly long in the tooth.  After all, we think there is a lot of truth to the statement put forward by several of the bloggers and analysts we follow that this is the “most hated bull market in history.”  Trend changes over the past few years in the direction of a risk-on trade are powerful.  Meanwhile, Fed and corporate bond model charts show that one can make a case that equities remain undervalued vis a vis various fixed income instruments.  We know from our work following various sentiment indicators that sentiment among investors remains tilted towards the pessimistic side long-term, favorable for markets from a contrarian standpoint.  Certainly, there are distortions in these charts related to the Fed’s extraordinary help over the past five years.  At some point, though, we have to look beyond Fed-only explanations.  


Friday, May 9, 2014

The Great Small-Cap Freak Out

If you haven’t heard, it’s been a tough year for small-cap stocks here and abroad.  YTD, the Russell 2000 is down over 5% and the MSCI World Small Cap Index is trailing the broader index.  Both indices are down strongly since early March.  The Russell 2000 has fallen approximately 9% and its international cousin has fallen approximately 4% over the past two months.

In our hypersensitive media environment, this of course has invited a number of breathless shotgun reactions as to what this means for markets moving forward.  A popular conclusion among many pundits centers on the story that the breakdown of small-cap indices relative to the broader indices is a massively negative early warning signal for a major market correction or collapse.  In reality, the historical record couldn’t be more different.  Looking back at the historical relationship between the Russell 2000 and the S&P 500 (we’ll go with these US indices because they have longer track records), cycle changes back towards large-cap outperformance have actually coincided with bull market activity.  

Don’t get us wrong, as we’ve mentioned on these pages before, the S&P 500 is overvalued based on several long-term valuation metrics we like to follow.  A US market correction could certainly pop up at any point, and would be a normal part of participating in the equity markets.  Looking at the relationship between small-caps and large-caps, however, it’s hard for us to accept the conclusion that the Russell 2000 breakdown of late is the end-all-be-all canary in the coalmine.

Here’s the chart going back to 1978 on Russell relative strength vis-a-vis the S&P 500.  The black band represents the +/- 1 standard deviation band around the long-term average.  


As we can see above, the Russell 2000 has experienced a sustained period of outperformance since the end of the 1990s.  This, in turn, followed a 20-year secular downward trend that began in the early 1980s.  What’s interesting about this?  The last time the Russell/SPX relative strength chart peeked its head above the +1 standard deviation bar and reversed (beginning the long secular small-cap underperformance trend through the 80s and 90s), the broader US markets were beginning 20-year secular bull market.  Conversely, the major trend-reversal towards small-cap outperformance that took place in the late 1990s happened to coincide with the beginning of terribly frustrating secular bear market that was in place from 2000 onward.  These trends contradict the conclusions out there that small-cap underperformance means major trouble in the near or intermediate term.   We’re definitely not making a prediction that this we’re in the beginning stages of a multi-decade secular bull market.  But, we think relying on small-cap stock index reversals as a warning indicator for broad market activity is misguided based on the record over the past 35 to 40 years.

So, what explains the reversal in small-caps?  The answer is very simple.  After approximately 15 years of sustained outperformance, small-cap stocks have become very expensive relative to their large-cap compatriots.  Matter of fact, they’ve become historically overvalued on a relative basis.  As of this week, the Russell 2000 is trading at 16x on an EV/EBITDA basis vs. 10.6x for the S&P 500.  We’ve looked at the ratio of the Russell valuation to the S&P 500 valuation over time.  That ratio is currently 1.5, slightly off the all time peak of 1.53 observed a few weeks ago.  Historically, the average ratio between the two multiples is 1.05.  The median is 1.05 as well.  Standard deviation for the weekly data going back to 1978 is approximately 0.145.  Therefore, the ratio of the Russell EV/EBITDA multiple to the S&P 500 multiple is currently a whopping 3.1 standard deviations above the norm.  This is a big, big outlier, which suggests that small-caps could and should be relative underperformers for a while.  If we use EV to Sales multiples, we see a similar picture.  The relationship is over 2 standard deviations above the norm.  


Therefore, we believe it’s premature to flip-out about the small-cap breakdown of late.  As shown, over the past four decades, Russell underperformance has actually coincided with broader secular bull performance.  Whatever the situation, the bigger story seems to be that if you have all your eggs in the small-cap basket, it may be time to start heading back towards the larger-cap space.  These secular shifts between small and large cap seem to take place every 15 to 20 years.  It looks like we could be on the cusp of one of those major shifts.  It doesn’t mean the end of the world is at hand.

Friday, May 2, 2014

Relative Strength Overview

Since the beginning of the year, there have been a number of changes taking place underneath the surface of the market.  We like to glance at the global sector relative strength charts regularly to get a visual on these changes and general sector performance over time relative to the MSCI World.  These simple relative strength charts often tell some interesting stories.   

Let’s run quickly through some of the standout shifts in the below charts:

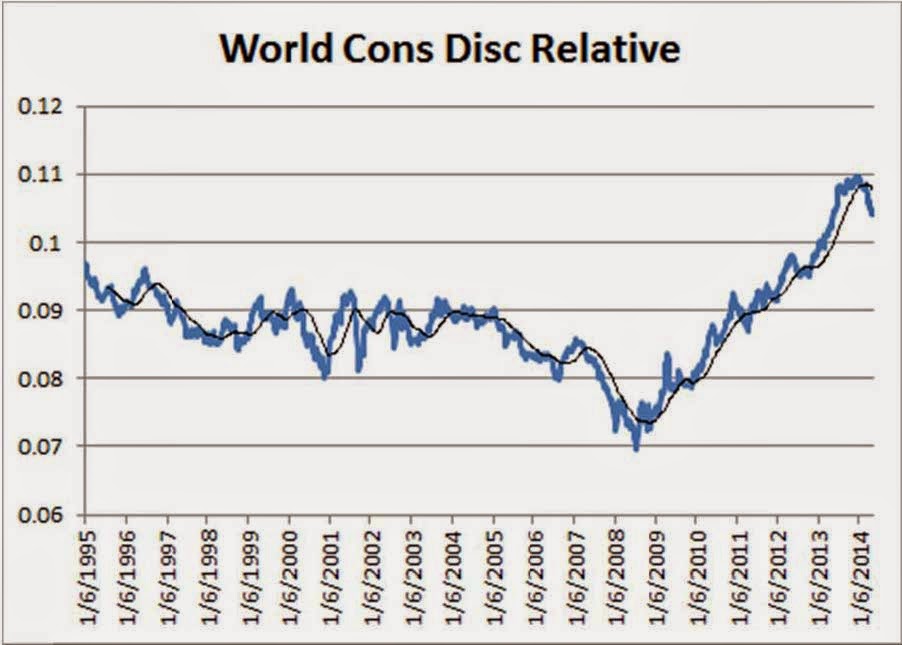
  • Consumer Discretionary, a big outperformer off the 2009 lows and a big outperformer last year, has broken down meaningfully versus the broader market.  The sector has experienced the first significant break of the 30-week moving average since the ‘06/’07 rollover.  Consumer Staples names began breaking down last year.  
  • The hook upward for utilities, not to mention the longer-term chart for Utilities, mirrors the Consumer Discretionary chart.  The Utilities sector happens to be the best performing sector year-to-date.  Is this a sign of the apocalypse?  Not necessarily.  Just because Utilities are trending higher and Consumer Discretionary is trending lower doesn’t mean markets are ready to dive into dark places.  Last decade, the Utilities sector began a long period of sustained outperformance in early 2004, while the Consumer Discretionary downshift occurred around the same time.  Markets continued to rise for another three and a half or four years.     
  • Energy and Materials are showing signs of life after a tough stretch.  Energy has underperformed since early 2009.  Materials names have been underwhelming for the past three years.  
  • Global Financials have remained yucky.  At best, the Financial space has matched market performance over the past five years.  One of these days, the sector will have another run of outperformance.  Right now, they continue to have a hard time finding breakout velocity versus the broader market.
  • Global Information Technology captures the investing public’s imagination and captures more headlines than less exciting areas of the market.  Yet, we see that coming off the big boom and bust in the late 1990s and early 2000s, IT has basically followed the broader market relative performance-wise.  The past four or five years have shown the same pattern.  Meanwhile, the Telecom space has also been a very, very tough place to find relative performance since the bust over a decade ago.
  • Health Care has chugged along quite nicely over the past three years.  There was some movement downward for HC during Q1, but the sector has recovered of late.  While there haven’t been any major trendline breakdowns here, this is a sector to watch.  During the back half of last decade’s market uptrend, HC demonstrated relative underperformance.
  • Industrials names have provided a mixed bag in recent years, though they’ve acted better of late.
  • Overall, the picture seems to be of a market that is shifting into a more mature, “mid-innings” phase.  Again, in 2004/2005, the middle of the last upward cycle, the Consumer oriented sectors and Health Care began underperforming while boring “stuff” like energy, materials, and utilities began exhibiting strength.  We seem to be seeing signs of a similar shift this go-round.  The shift wasn’t a death-knell for the overall markets then.  We don’t believe that massive market disruption is in the cards right now either.  The above sector shifts fit in well with some of the other work we’ve presented on this blog during the past several months indicating that global markets could be moving towards a period of solid, not spectacular, maybe a bit frustrating returns over the next few years.  Looking forward, will IT, Telecom, and Financials break out of their relative strength doldrums?


Friday, April 25, 2014

Round and Round

As of today’s close, the S&P 500 is up 0.81% on a simple price basis.  Except for the late January correction and subsequent rally, this has been the quintessential “dog chasing its tail” type market year to date.  

While there are three trading days left in April, and anything can happen of course, we thought it might be interesting to see what has happened in the past when the S&P 500 has finished the first third of the year near flattish levels.  Why the first third?  Nearly everyone focuses on quarterly data.  Why not look at sometime a little different.  And, April leads into May, the beginning of a historically week seasonal period.  Remember, we should all sell in May and Go Away.  April just might be a good spot on the calendar to evaluate performance dynamics.  

We looked back over the past 83 years of S&P data and learned a few things.  First, it’s somewhat rare for the S&P 500 to finish the first third of the year near the zero line.  There have been only 14 instances over the past 83 years where the S&P 500 finished within a +2% to -2% range over the first four months.  Second, there’ve only been five instances where the market has finished the first third of the year between 0% and +2%, the range that pertains to this year’s market.  

So, what happens the rest of the year when the market starts off flattish?  

Looking at the 14 overall instances where the market has begun the year within + or – 2% of the zero line, there are frankly no solid conclusions to draw from the data.  Average total year returns for those years is -1.15% and median performance is 2.76%.  However, the standard deviation of yearly returns is a whopping 17.6%.  Full-year returns ranged from +25.8% to -47.1%.  

Keep in mind, though, that 9 out of the 14 yearly results during the first third fell between 0% and -2%.  In those nine years, average full year returns were -5% and median full year returns were negative 10.1%, with a standard deviation of 20.9%.

Focusing on the 5 years that ended the first third between 0% and +2%, the picture is more encouraging, though we’ll admit that 5 occurrences is far from meeting the standard of statistical significance.  Average full year returns for the five year: 5.8%.  Full year median returns come in at 7.1%.  The standard deviation is a much tighter 5.8%.  All in all, this presents a much better picture than the volatile, negative stats above.  Four out of the five years that finished the first third of the year between 0% and +2% closed out the full year in positive territory.


Are there any conclusions to draw?  As mentioned, statistical significance is lagging.  And the overall data is all over the place.  But, if we had to choose, we’d err on the side of hoping that the S&P 500 can finish April on the positive side of zero.  Many have struggled to explain the January effect through the years. Maybe, this situation is similar.  There’s no rational reason why the market should behave markedly different the rest of the year based on the fact that the market happens to be slightly on one side or the other of zero.  Yet, looking at the past numbers, if April can close around these levels, just on the right side of zero, it will fit in with our expectations from other statistical research that 2014 should be a modest but OK year.  A negative close to the month may, rationally or irrationally, open markets up to a volatile and frustrating final nine months.  

Friday, April 11, 2014

When Momentum Bites Back

In a broader sense, the “dog chasing its tail” market action continues.  All said, the S&P 500 entered today (Friday) down less than 1% for the year and the broader New York Stock Exchange Index was actually around flattish.  Put in those terms, we see a market that is certainly frustrating for those that became accustomed to last year’s steady and satisfying upward march, yet a round and round yawner at the end of the day.  Why all the hand-wringing, then, with this week’s declines?  The high-flying momentum names have been crushed.  These are the names that have been media darlings and obsessions for months and that have produced some amazing returns over the past two years.  Biotech has been completely beat up, with the biotech ETF falling nearly 20% from its peak on February 25th (though amazingly it’s still basically flat for the year).  Techie names such as Tesla, Facebook, Amazon, and others have faced heavy distribution.  

What’s the lesson here?  You live by the sword you die by the sword.

We’ve seen a bunch of whining in the popular business press about a “lack of justification” for the momentum selloff or a lack of catalysts or news.  There was a particularly funny article in the Wall St. Journal this morning concerning the biotech sector selloff with one analyst proclaiming, “Horrible day in #biotech.  I’m frankly at a loss for an explanation.  And it’s my job to at least know why.  Humbling day.”  Another gem comes from an analyst that had the gall to express a cautious view about the sector: “At some meetings and dinners with investors’ nerves have become frayed and tempers a little flared,’ he said.  ‘Nothing in an aggressive way, but: ‘Why are you doing this?...Why are you ending this terrific ride?”  Again, let us remind you that the sector was up approximately 100% between 12/31/2012 and the end of February 2014.  Facebook stock was up 175% from 6/30/13 to the end of Februrary.  The list goes on and on.

Growth and momentum strategies are perfectly valid ways to approach the investment universe.  We happen to prefer the value side over the long run; there are plenty of professional and individual investors, however, that know the growth markets inside and out and have generated very successful long-term track records navigating the space.  In value, the big risk oftentimes is getting into names too early and having them move against you, or buying the dreaded “value trap.”  The key is making sure that risk management techniques are such that the “value traps” don’t drown bog down performance.  In growth, the key seems to be capturing gains in names that trade at very high multiples before the dreaded “missed expectations” bug hits and brings performance down to earth, or before profit-taking morphs into broader, more violent declines, which is probably the case here.  

In any case, we know that over the long-run, regression to the mean exists, companies’ growth prospects ultimately return to a normal trajectory, and that valuation multiples tend to compress back to more pedestrian levels.  Looking at some of the multiples for the names and sectors that have been hit, it shouldn’t be a surprise that they’re facing this type of volatility.  The biotech sector, for instance, is trading with a price to book of 7.51x, approximately 3x the level for the broader S&P 500.  On a price to sales basis, the level is 7.9x versus 1.7x for the S&P 500.  Price to cash flow?  The average for the underlying names is 50.75x, upwards of 5x the level for the S&P 500.  Amazon?  The EV/EBITDA is 34x and price to book is 14.8x.  Facebook?  EV/EBITDA comes in at 37.7x and price to book 9.8x.  Priceline?  22x and 8.8x respectively.  Yes, some of these companies are growing rapidly though even at very generous growth rates it’s hard to back into and justify these valuations.  Sky high multiples form the basis for the performance air pockets seen from time to time in these names.  


In the end, trade away in the super-momentum stocks all you want and enjoy the good times when they happen.  Don’t complain, though, when emotion and sentiment reverse and investors begin refocusing on valuation metrics and other factors creating big-time downward thrusts.  Ultimately, valuation does matter.  While nothing we’ve observed in recent weeks comes close to the tech frenzy of 1999, there are companies whose stock prices were running on fumes that have seen price declines of 40% to 50% plus in a matter of weeks.  Getting caught up in media and market sentiment driven frenzies while taking the eye off the valuation ball can lead to some significant pain and volatility in portfolios.  Unfortunately, those with the least experience in markets end up piling into these names at the end of the run.  The more things change the more they stay the same.

Saturday, April 5, 2014

Sentiment Picture: Q1 End

After a full quarter of “dog chasing its tail” type action in global markets, various global indices ended Q1 at or near highs.  All of this happened in spite of a backdrop of China fears, Ukraine fears, polar vortex fears, US growth fears, valuation fears, European deflation fears, fear of flying, fear of Ebola, and fear of earthquakes.  After everything US and global markets have “endured” these first three months, we’ve been rather impressed with market resiliency.

Following whirlwind quarters like the one just experienced, we like to check in on how various sentiment indicators in the marketplace are lining up.  When the market is breaking to new highs, we’re always a little more encouraged when sentiment leans to the dour side.  Interestingly, that’s exactly what’s happened.  The sentiment indicators we follow indicate mild caution, which we’ve found generally supportive of market performance.  

Let’s begin with the US CBOE equity Put/Call ratio.  Again, we use the 10-day moving average to smooth out some of the noise.  Last time we checked in ahead of the Q1 market correction, this indicator had hit some of the lowest (more bullish) levels observed over the past several years.  The correction and general negative noise in the marketplace have brought this indictor back above the long-term median and back to the middle of the range observed over the past several years despite the fact that the S&P 500 has moved into new all-time (nominal) high territory.  

Next, the ISES All Equities Sentiment Index, which also captures sentiment in the options market, shows a similar picture.  At the beginning of 2014, the 10-day average had reached the highest levels (more optimism) in two years.  Since then, at 152.50, the indicator has dropped back into the more cautious “wall of worry” range it’s occupied since early to mid 2012.  

The Farrell Individual Investment Sentiment Indicator uses the bull/bear/neutral readings each week to provide a picture on overall sentiment.  Sounding like a broken record, this indicator had moved above historical median early this year towards the highest levels observed since early 2011.  Since then, even with market grinding higher, the 10-week average has now moved back below median levels.

Finally, the 4-week moving average for the BNP Paribas Love-Panic Market Timing Indicator gives a picture of sentiment over in Europe.  Europe has been acting swimmingly of late, yet sentiment remains in neutral territory.

Taking all into consideration, market participants aren’t demonstrating outrageous pessimism.  Nonetheless, it’s interesting and mildly encouraging that investors maintain a healthy dose of skepticism while global and US markets have found a way to move towards new highs.  Likewise, though there’s been some noise associated with weather in the US and abroad, there’s no indication at this point that developed market economies face immediate recession dangers.  The overall backdrop isn’t completely hunky-dory for markets.  For instance, we remain concerned intermediate-term about valuation levels in the US markets.  Until we see a combination of overly optimistic sentiment, negative market momentum, and cracks in the growth trajectories for the leading developed markets, we’ll have to give equity markets the benefit of the doubt right now.

Friday, March 28, 2014

Bracketology and Value

Granted, there’s still plenty of time left in the NCAA tournament (and a number of games to lose), but after last night’s Sweet 16 matchups, this writer finds himself in first place in one large competitive bracket and two points out of first place in another.  In both cases, the brackets are at or near the top in terms of possible remaining points.  I wish I could tell you this was the result of some magnificent accumulation of college basketball wisdom or hours upon hours of diligent bracket study.  In reality, it’s no exaggeration to say that I’ve not watched one entire college basketball game this entire season, perhaps not even one complete half.  Embarrassingly, I’ve listened to several of the better tourney games driving in the car and had to pay very close attention to the team possession information because none of the players’ names ring a bell.  I’m so ill informed that I become confused and tune out. 

How could this happen?  Instead of poring over bracket decisions, I decided to blindly follow the bracket recommended by a leading statistical expert, who used several relatively simple inputs to develop probabilities for each game, start to finish.  My brackets took me less than five minutes to fill out.  The past several years prior, I used a different statistical model to fill out brackets with similar solid results.  These past brackets were filled out quickly, the morning of the first games.  I’ve never won, and I probably won’t win this year due to randomness and dumb luck, but I’ve always been smack-dab in the running the final week and finished near the top.  Separately, over the past seven or eight fall college football seasons, I’ve participated in a running weekly pick-em pool that involves roughly 25 games per week over the course of the entire season.  Beginning year before last, I abandoned qualitative judgment and picked solely on a publicly available statistical model.  Each week, I purposefully ignore all qualitative information and pick solely based upon the model, no matter how badly my brain wants to change some of the answers.  The results: a first place finish the first year and a third place finish this past year.  

What does this have to do with value investing?  A bunch, actually, in our opinion.  In past blog posts, we’ve talked about the “fundamental free lunches” available in the equities market place.  Simply, we’ve shown that buying individual stocks year over year that are bottom of the barrel in terms of quantitative valuation according to several simple fundamental metrics leads to statistically significant long-term outperformance.  You literally didn’t need to know one thing about any of the stocks picked through the years to achieve the outperformance over the long run.  Actually, in most cases, the stocks picked would have caused the rational part of your brain to go entirely haywire.  By nature, many true value stocks have fallen out of favor for one reason or another, whether management problems, fraud, secular industry decline, or product issues.   Yet, time and time again, a number of these names eventually revert back to the mean generating solid returns.  On the flip side, the highflying names that are usually showing up on the front covers of the daily business papers and weekly magazines are overvalued and prone to revert downward over time.  

Like the NCAA bracket and college football examples above, the value investing process is ultimately a probability issue.  Our simple examples in past blog posts and a bunch of academic research shows that if you pick bottom decile stocks valuation-wise, for instance, the odds work in your favor that portfolio performance will come in above the averages over longer time periods.  Unfortunately, the human brain is subject to a number of biases that lead us to make a bunch of regrettable decisions.  In the bracket examples above, objectively picking using the statistical model eliminates the biases we have from a number of different directions, such as tendencies to pick traditional powerhouse teams, or to favor teams from a certain conference or geographical region, or that have a star player we really like.  In the stock-picking world, similar qualitative biases lead us to shun the cheap companies and chase the overvalued.  Our brains tell us to avoid the undervalued because the management team is in turmoil perhaps, or because the last product was an absolute flop.  Meanwhile, we buy because the CEO is on the cover of Forbes, or because their particular widget is the darling of the tech or retail world.  Doing so leads to substandard returns.  Several studies, for instance show that retail and institutional investors generally have an awful market-timing track record, buying wholeheartedly at market peaks and selling hand over fist at market bottoms.

There are caveats, however, to taking objective approaches.  
  • First, you need to find the right metrics or models.  In the investing world, we know that certain fundamental multiples like price to book and EV/EBITDA are far better long-term performance predictors than metrics such as forward P/E ratios.  In our NCAA bracket and football examples above, we used models that have been developed over long periods of time.  A tourney bracket based upon the relative positions of the moon and stars in the sky at various points during the tourney probably wouldn’t get you very far.  Keep in mind, it’s important not choosing metrics or models because they tell you what you want to hear all the time.  
  • Second, you have to commit yourself to the process and maintain discipline, no matter how bad it hurts.  In value investing, it’s easy to come up with a million different reasons why a certain company’s stock shouldn’t get consideration.  There are ways to mitigate this anxiety.  For instance, one can employ risk management rules or technical analysis to ensure that a particular name doesn’t harm performance in an outsized way.  Nonetheless, even with risk procedures in place, it’s very difficult mentally to get involved in names that aren’t necessarily belles of the stock-picking ball.  Likewise, in clicking the teams for my bracket, rest assured there were many tempting overrides.  
  • Third, and perhaps most important, one has to understand that taking probabilistic approaches doesn’t guarantee you win every time period.  Patience is absolutely a key part.  Consistency becomes more important than shooting the lights out.  In markets, sometimes value is in favor, sometimes it isn’t.  In past blog posts, we showed several year stretches where certain fundamental metrics underperformed only to come back with a vengeance on the upside.  Many investors lose patience with a process due to a stretch of underperformance and abandon the process at precisely the wrong moment instead.  Our “humanness” gets in the way.  Take the football pool.  On the way to those first and third place finishes, this writer rarely won the weekly intervals outright.  However, rarely were the picks at the very bottom of the pool in any given week.  Surely, a few weeks were stinkers, but the odds eventually won out over the course of 14 weeks.  Grind-it-out consistency is the central idea, not too dissimilar to the tortoise vs. hare example.

We’ll see how the rest of the tourney plays out.  Whether the bracket finishes first or not, we know it’s been a good run.  Plus, we’ll know the outcome one-way or the other within a week!  Markets, however, test patience, consistency, and discipline over years and decades.  Academics and investors have asked repeatedly how efficient or moderately efficient markets can continue to offer a value premium over long periods of time.  Perhaps it’s best summed up in quote attributed to John Maynard Keynes: “Markets can remain irrational a lot longer than you and I can remain solvent.”